Platform information checked 2026-10-26. Use a supported Unix-like platform and a terminal with the required UTF-8/font support. Homebrew must already be installed for the macOS command. GPU and sensor coverage varies by OS and hardware; this review does not certify a Windows fork.
Inspect resource use and processes from a terminal on a supported computer.
Free terminal resource monitor
The Apache-2.0 monitor has no required software subscription. It runs on your own supported system; hosting is separate if that system is a rented server. Available metrics depend on OS, hardware, drivers and permissions. It is a terminal alternative for selected iStat Menus resource-monitoring tasks, without its macOS menu-bar, weather and notification suite.
Monitor CPU, memory, disks, network and processes in a terminal with live graphs and keyboard controls. Visit the project website to check the currently available deployment options.
Release status
Public provider installation or download instructions reviewed; AltStack did not execute this software.
Install on your computer · Instructions checked 2026-10-26
Open the official btop README and choose its supported package or release for your operating system.
On macOS with Homebrew installed, the provider documents brew install btop. Linux and BSD systems have separate instructions.
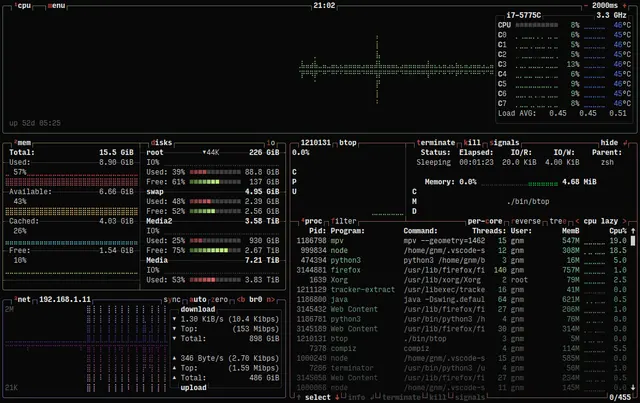
Start btop in a terminal and inspect its CPU, memory, network and process panels.
Use the built-in help and settings before changing filters, layout or update intervals.
Treat process signaling as a separate deliberate action. Hardware-specific GPU and sensor data requires the provider’s compatibility guidance.
The Apache-2.0 monitor has no required software subscription. It runs on your own supported system; hosting is separate if that system is a rented server. Available metrics depend on OS, hardware, drivers and permissions. It is a terminal alternative for selected iStat Menus resource-monitoring tasks, without its macOS menu-bar, weather and notification suite.
Self-hosting & quickstart specs
License
Apache-2.0
Deployment
Local terminal system monitor
Free edition / costs
Free terminal resource monitor. The Apache-2.0 monitor has no required software subscription. It runs on your own supported system; hosting is separate if that system is a rented server. Available metrics depend on OS, hardware, drivers and permissions. It is a terminal alternative for selected iStat Menus resource-monitoring tasks, without its macOS menu-bar, weather and notification suite. Pricing evidence.
Devices / hardware
Use a supported Unix-like platform and a terminal with the required UTF-8/font support. Homebrew must already be installed for the macOS command. GPU and sensor coverage varies by OS and hardware; this review does not certify a Windows fork.
brew install btop
Documented provider installation command for the stated platform and prerequisites. AltStack reviewed the instructions and did not run this command.
Documentation checked 2026-10-26; command not executed by AltStack.
Self-hosted uptime monitoring with a clean dashboard.
Official README provides a self-hosted monitoring tool with local/container installation under MIT; demo is temporary and not hosted production monitoring. Servers and notification-provider costs remain external.
Real-time monitoring for systems and applications.
Netdata's GPLv3+ Agent provides the monitoring core. The UI uses a separate Netdata license, and Cloud has a free community tier plus paid enterprise features. This check confirms the source Agent scope, not unrestricted licensing of every dashboard or unlimited cloud functionality; your storage and hosts cost extra.
Free Cloud tier · Pro from USD 19/month plus usage
Unified observability for metrics, logs, traces, and more.
Grafana Cloud Free costs USD 0 with service-specific usage limits. Pro starts at USD 19/month plus usage; Enterprise starts at USD 25,000/year spend commitment. AGPL self-hosted Grafana uses your infrastructure and does not include unlimited cloud telemetry or enterprise features.
Open source metrics collection, storage, and alerting.
The Prometheus repository edition is available under Apache-2.0 with documented installation or build instructions and no required source-license subscription. Your server, storage, backups and administration remain your costs. This check covers that source edition; managed services, premium extensions and commercial relicensing, if offered, are not included or price-verified.
Open-source observability platform for cloud-native apps.
Official README explicitly offers free self-hosted SigNoz. Cloud has a $49/month minimum including $49 usage, then logs/traces $0.30/GB and metrics $0.10/M samples. Root license excludes ee/cmd/enterprise from core terms; starting-free wording refers to onboarding/trial.
Advanced vulnerability detection and management platform.
Linked Nuclei is a public MIT scanner. ProjectDiscovery's current Neo pricing has Free limited one-time usage and paid plans from $200/seat/month, plus Enterprise; do not treat a scanner license as unlimited free hosted scanning/AI.